The Statistical Oddity of the Dow and 20,000
The Dow finally hit 20,000. I wouldn’t ordinarily put much importance on an arbitrary milestone (see The Dow 20,000...Should We Care?), but the long hover just below this level was extraordinary. This is not to say that markets need behave in any predictable manner. Daily movements of the market tend to behave like random walks, and random walks commonly exhibit long streaks and other seemingly unusual behavior. But the recent history of the Dow went far beyond what can be easily explained as a random walk.
The aftermath of the US presidential election began a period of rapidly rising stock prices in the US, where the Dow went from approximately 18,000 just before the election to 19,757 on December 9, 2016. With 20,000 within a historically typical day’s volatility (a 1.2% increase), the financial media began to buzz with talk of the Dow 20,000. But the following days had small market movements. This in itself would not be surprising, but days turned to weeks of small declines and advances where the Dow neither exceeded 20,000 nor fell much below it. Can this period be explained by statistics as a random walk, or is it possible the market places significance on the Dow milestone and is expressing doubt about the expectations of recent events?
As it turns out, this was a period of extremely low volatility. The VIX closed yesterday at 10.8%, its low since 2014. Even more unusual was the daily standard deviation of the Dow from December 9 through January 25, a mere 35bp, which annualizes to roughly 5.5%. But the odds of the Dow staying in this narrow range (it reached as high as 19,999.63 on January 6th) are vanishingly small. (Monte Carlo simulations showed the probability at less than 1 in 10,000, or much, much lower depending on volatility assumptions used—a penny would have been expensive for an option that paid $10 if the Dow remained above 19,700, but below 20,000.) Yet that’s what happened. The analysis is included in the table below, but I will draw my conclusions now. Extraordinary investor uncertainty about the intentions of the new administration as well as a variety of speculative reasons abound for why the market stalled so close to this milestone, but we can state with very high confidence that the market did not follow a random walk for 30 trading days—a contradiction of reliable financial theory of normal functioning markets. The good news for those of us who believe in rational markets is that I see no reason for this to persist or be repeated in the future. Now that it’s over, I’ll go back to expecting the unexpected ups and downs of the market.
Appendix
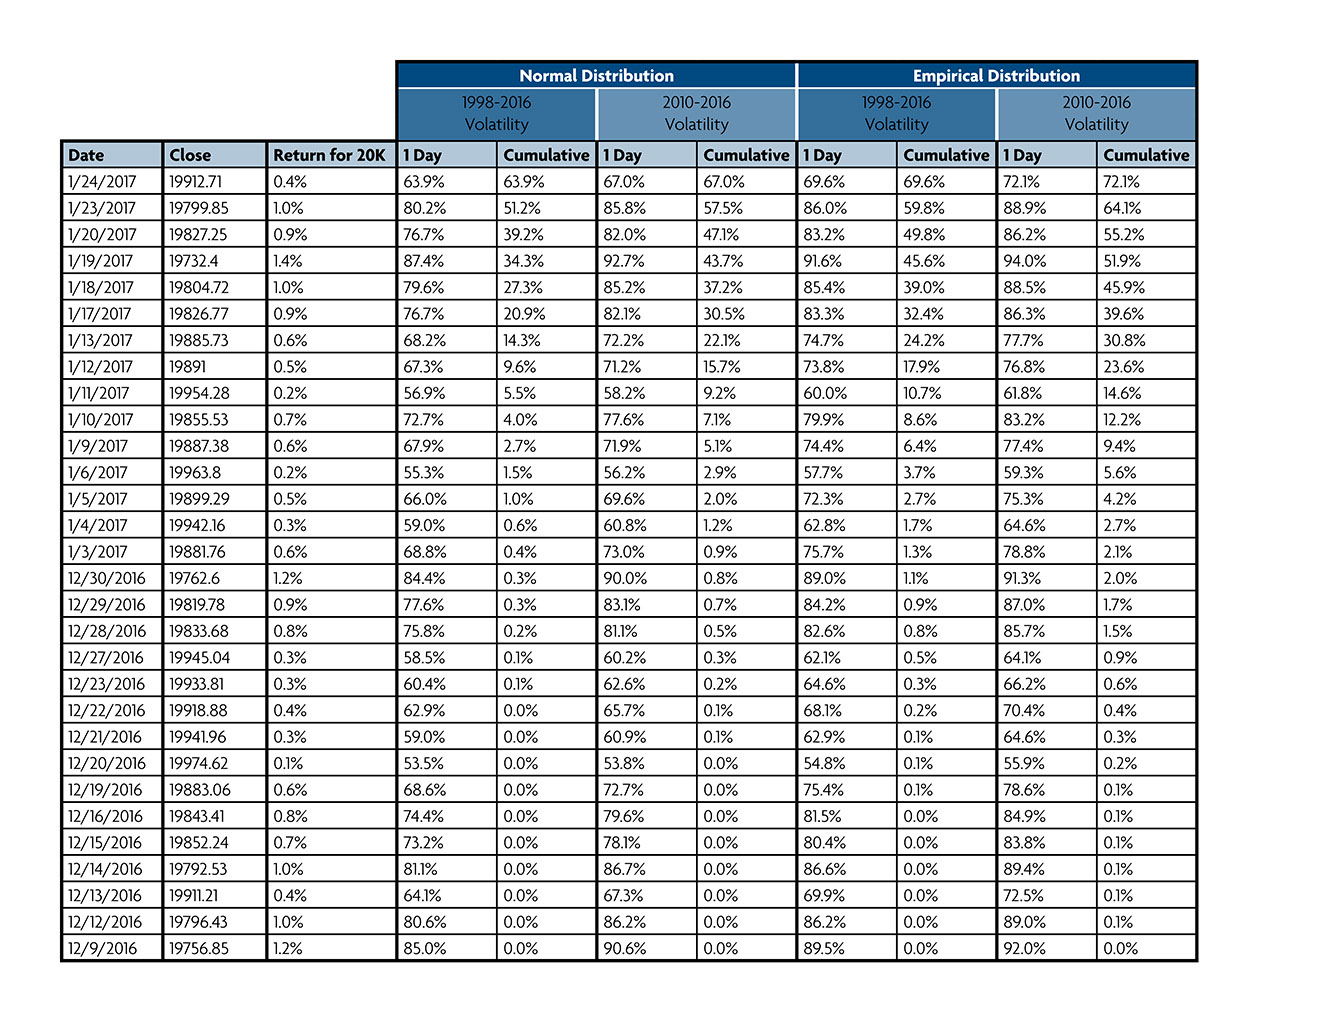
To get as robust an estimate as possible on the distribution of daily returns on the Dow, I used both the normal distribution (where future daily returns are drawn from a normal distribution fit from past daily returns) as well as the empirical distribution (where future daily returns are drawn from past daily returns). For these, I chose two time periods for the data: the last 20 years, and the lower volatility period beginning in 2010. While these give slightly different values, the overall answer is clear. It’s highly improbable that markets are behaving normally, and some weight should be given to possibility that investors are wary of the 20,000 mark in the Dow.
The following table lists the Dow’s closing price and shortfall from 20,000 followed by four measures of the probability it will reach 20,000 on the next day based on normal/empirical distributions based data since 2010/1996 followed by the cumulative probability of each of those daily events not happening.
comments powered by Disqus
Need more information?
Contact us to find out how we can work with you.