Skip to main content Skip to footer

Perspectives

On Point: The Frontier Edition - Distinct by Design: Why Our Optimized Portfolios Don’t Move in Sync

6 Minute Read

TOPICS
On Point: The Frontier Edition - Distinct by Design: Why Our Optimized Portfolios Don’t Move in Sync

Summary

  • Well-optimized portfolios can result in a better fit for investors’ goals
  • Portfolios that only shift the allocation of stocks vs. bonds don’t customize the underlying holdings to address investor risk and return preferences
  • At New Frontier, each portfolio on the efficient frontier is a unique solution – optimized to achieve its own investment objective, not a scaled version of another

Uncorrelated returns reflect customized optimization

New Frontier’s conservative and aggressive portfolios sometimes move in different directions. This contrasts to traditional portfolios, where different risk targets within a strategy move in the same direction, just more or less. However, the difference highlights a feature of properly-optimized portfolios – conservative and aggressive portfolios should perform differently because they’re made for different investment goals (as illustrated in the first figure below).

Allocations are optimized independently

The holdings in an optimized conservative portfolio differ from a scaled-down version of its aggressive counterpart. This is a feature of properly-optimized portfolios – the efficient frontier famously curves because every point on it represents a uniquely optimized combination of assets. Therefore, our portfolios are designed to have different risk exposures, not just different risk amounts, and will react differently to economic news. The results are a better fit for investor goals.

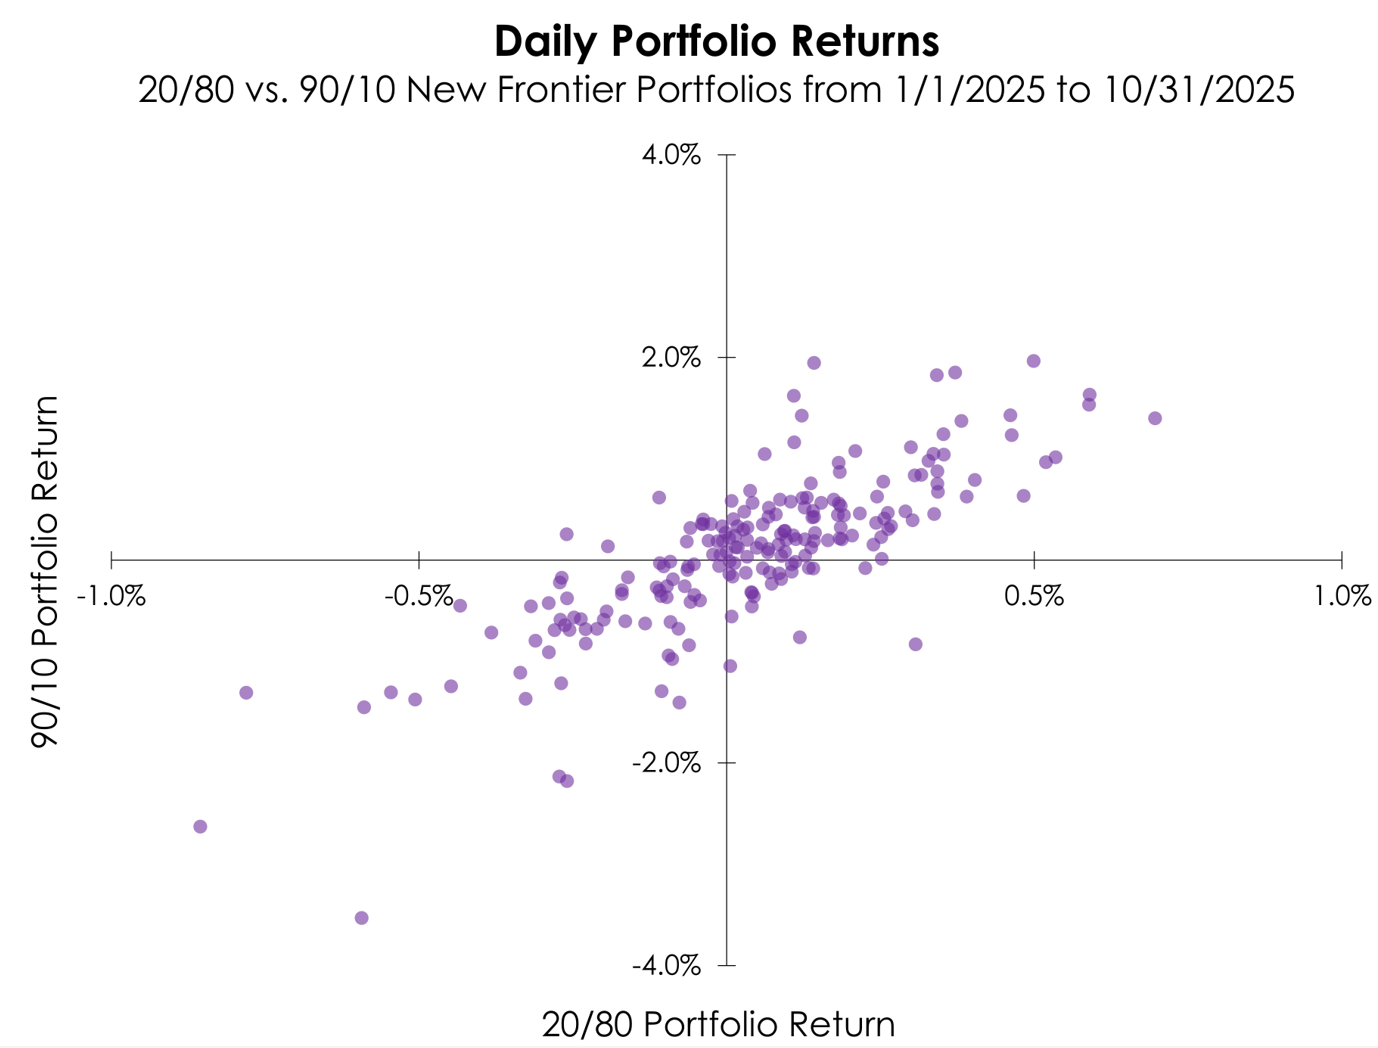
New Frontier Portfolios Do Not Move in Sync

The chart below plots the daily returns YTD of our aggressive 90/10 portfolio (Y-axis) against our conservative 20/80 portfolio (X-axis). The purple dots represent the realized returns of both optimized New Frontier portfolios on a given date. These deviate from a straight-line relationship, highlighting their different reactions to markets day-by-day – observations in the top-left and bottom-right quadrants are examples where the two portfolios moved in opposite directions.

Source: Bloomberg/New Frontier calculations

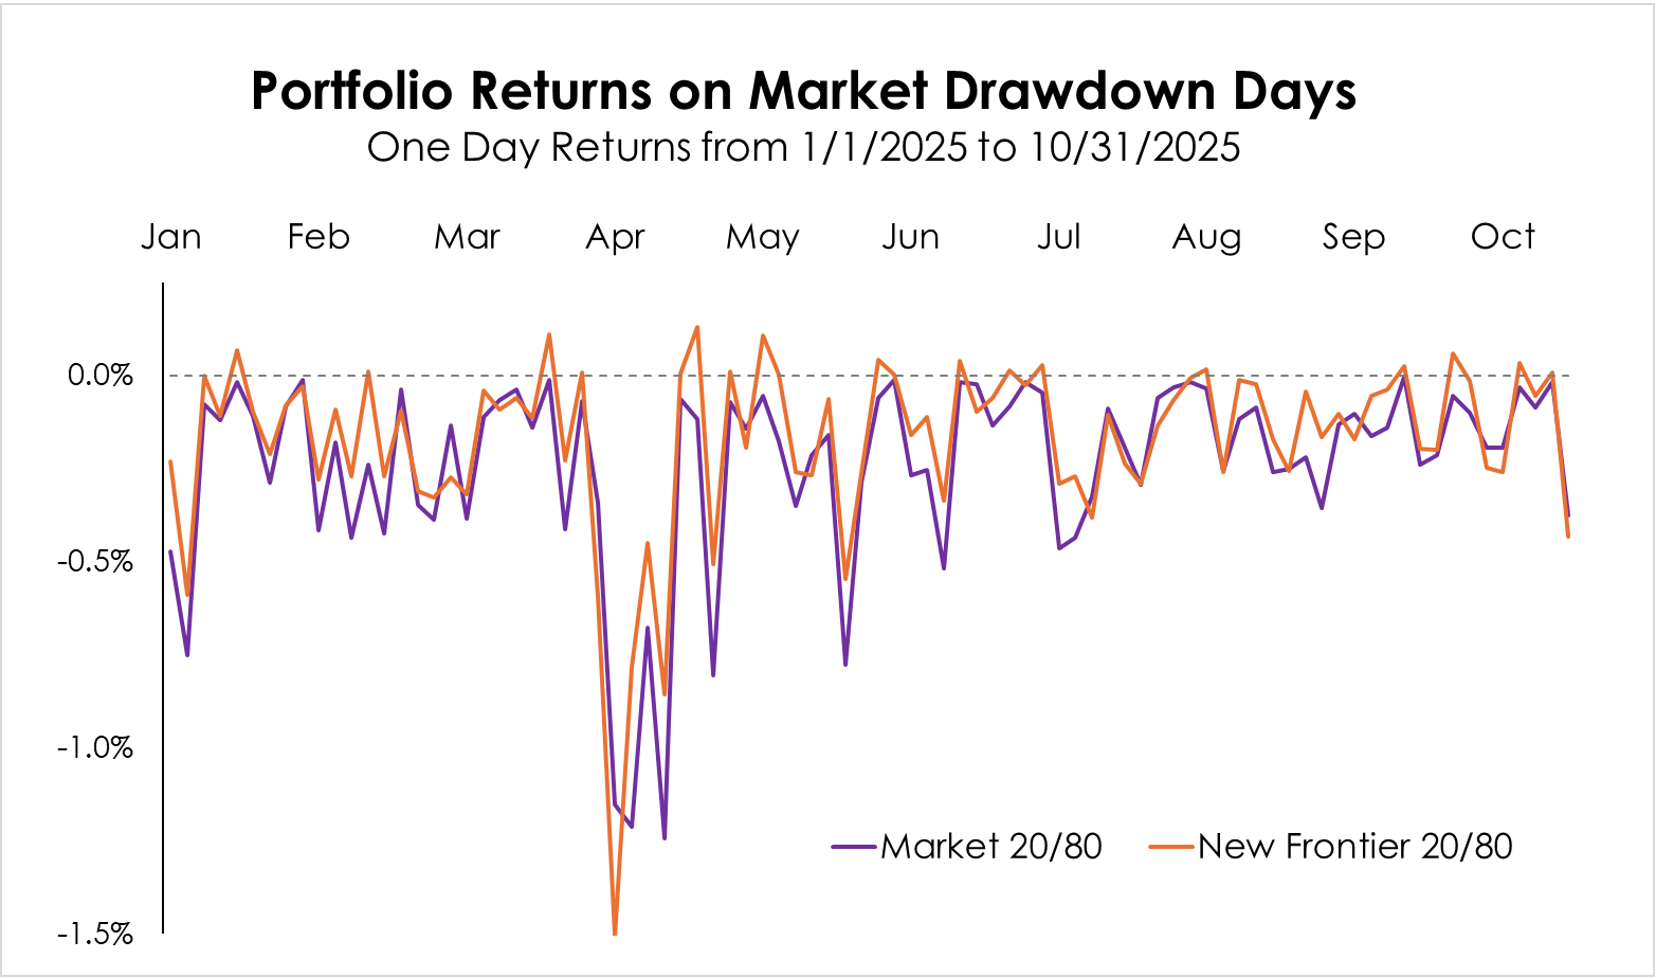
Optimized Conservative Portfolios Manage Risk

The chart below plots the daily returns YTD of both the 20/80 market portfolio (purple, calculated as 20/80 weighted ACWI/AGG daily return) and New Frontier’s optimized conservative 20/80 portfolio (orange), on days when the market lost value. While both were subject to the downside of the market, particularly the April volatility, the optimized portfolio generally exhibited less volatility and lower declines.


Market 20/80

New Frontier 20/80

Average Return

-0.24%

-0.17%

Annualized STD

4.11%

3.80%

 Source: Bloomberg/New Frontier calculations


In Conclusion

At New Frontier, our conservative and aggressive portfolios sometimes move in different directions – and that’s not a mistake, it’s design.

Our conservative portfolio isn’t just a dampened version of an aggressive one. Each portfolio is independently optimized to achieve a distinct investment goal, with its own mix of risks and exposures. That’s why well-constructed portfolios often react differently to market shifts – and why that difference can better serve investors’ objectives.


Past performance does not guarantee future results. There are risks involved with investing, including possible loss of principal. 

New Frontier Advisors LLC (“New Frontier”) is a federally registered investment adviser based in Boston, MA. The information discussed here is for information purposes only. Past performance does not guarantee future results. As market conditions fluctuate, the investment return and principal value of any investment will change. Diversification may not protect against market risk. There are risks involved with investing, including possible loss of principal. Before investing in any investment portfolio, the investor and Financial Advisor should carefully consider the investor’s investment objectives, time horizon, risk tolerance, and fees.

New Frontier is retained as a portfolio strategist ("Strategist") to provide model portfolios. Model portfolios are provided either (l) to registered investment advisors or broker-dealers ("Financial Advisors") through third-party asset management platforms ("Sponsors"), or (2) to individual clients where New Frontier acts as subadvisor to the client's Financial Advisor and accesses the client's account through a qualified custodian ("Custodian") to execute the model portfolio's transactions. New Frontier does not provide investment advisory services tailored to the individual needs and objectives of any investor. New Frontier acts solely as subadvisor, strategist, model provider, and/or model manager, and its relationship with any investor is limited to a subadvisory role working with the investor's Financial Advisor. Investors should consult with their Financial Advisor if they have any questions concerning the information provided here.

Performance shown is for New Frontier ETF Global Income (20/80) at Sponsors. Returns from inception on October 29, 2004, until July l, 2009 do not reflect the actual investment results of any individual investor, as investor-level data is not available for those periods. Therefore, these returns represent the performance of a hypothetical investor's account whose assets were managed in line with the model portfolio during that period, assuming the model portfolio's signals were promptly implemented. Actual investors' performance results for those periods would have varied based upon the timing of contributions and withdrawals from individual accounts. Since July l, 2009 when investor-level account data became available, performance results are a weighted average of actual investor returns in accounts following the model portfolio. Returns in excess of one year are annualized.

Performance shown is for New Frontier ETF Global Growth (90/10) at Sponsors. Returns from inception on October 29, 2004, until July l, 2009 do not reflect the actual investment results of any individual investor, as investor-level data is not available for those periods. Therefore, these returns represent the performance of a hypothetical investor's account whose assets were managed in line with the model portfolio during that period, assuming the model portfolio's signals were promptly implemented. Actual investors' performance results for those periods would have varied based upon the timing of contributions and withdrawals from individual accounts. Since July l, 2009 when investor-level account data became available, performance results are a weighted average of actual investor returns in accounts following the model portfolio. Returns in excess of one year are annualized.

New Frontier acquires gross of fees monthly composite performance data of the accounts invested in each model portfolio at each Sponsor and weights the returns according to each Sponsor's assets under management for that model. Some Sponsors provide insufficient performance information for New Frontier to include them in the weighted average. Each Sponsor sets the criteria for account exclusion and rules for return calculation on the account level. We consider our partner Sponsors to be reliable sources of information, but we are unable to warrant that the data will be complete or error-free as we do not have direct access to individual account data at any of our Sponsors. We also track our model portfolios using publicly available ETF prices as an outside check on Sponsor data.

In order to show net performance, we deduct estimated Strategist and Sponsor fees from the historical data provided by our Sponsors at the highest fee rate reflected by an account in the composite for that Sponsor. Fees are subtracted on a quarterly basis, so performance for less than one quarter may not show the full impact of fees. It does not include your Financial Advisor's fees or any trading or custodial fees applicable to your account. On one small platform, the custody fees are deducted since they are not separated from the Sponsor fee. The performance shown includes reinvestment of income, deductions for transaction costs, and rebalancing according to the Strategist's buy/sell signals. If gross performance is shown in addition to net performance, the reported gross performance excludes all of the above fees except underlying ETF and trading fees. At the time of publication, a majority of custodians are not charging a trading fee for domestic stock trades or ETF trades. The reported gross performance excludes all fees except the underlying ETF fees, and as such does not reflect the compounding effect of those fees. The deduction of advisory, custodial, and trading fees would lower historical performance as net performance does not reflect the compounding effect of those fees.

Link to Author Bio