Building on Brilliance: Honoring Harry Markowitz and the Enduring Power of Portfolio Theory
In a quarter filled with talk of potential Treasury default and the second largest bank failure in U.S. history, markets chose to look forward. This was a quarter of AI captivating markets. The S&P entered bull market territory, catching up to international markets which had recovered earlier from the lows of last October. But for those of us who knew him, the events of the quarter were overshadowed by the loss of Harry Markowitz.
Harry Markowitz, Father of Portfolio Theory
The greatest loss of the quarter occurred on June 22, marking the passing of Harry Markowitz. Harry’s substantial contributions to finance established the modern concept of a portfolio. The concept was simple—portfolios must be diversified since no one should take more risk than they need to. But the answer to intelligently diversify a portfolio required math and technology for Mean-Variance Optimization (MVO) that had not been invented.
Without MVO, investing was done one stock at a time. Investors would typically only invest in a small number of stocks they determined to be most desirable on an individual basis and weight them by hand. This thinking is still pervasive – many investors focus on one stock, or even fund at a time and ignore correlation between assets as well as the tradeoff between risk and return.
Unfortunately, the problems of Modern Portfolio Theory (MPT) as implemented by many investors are unfairly attributed to his work. For example, MPT is often criticized for relying on historical data and being backward looking, but Harry understood that the reason to diversify is precisely because the future may not perform like the past.
His 1952 paper was just the beginning for the efficient frontier. Harry understood risk and return are never accurately known, and that “investing needs tweaking.” (He once told me portfolios are never perfect and he was proud to be a tweaker.) On the practical side, he explored many different return and risk estimates in order to find one that would produce what has to be the right answer—an intuitively diversified portfolio.
Practical issues like investor rationality and academic concerns, such as quadratic, utility, or normally distributed returns, were addressed in early papers on behavioral issues, and later in mathematical papers on the wide applicability of the mean variance frontier to most practical investment problems.
Another insight into the efficient frontier is that it sets expectations for what’s possible. If someone suggests they can provide more return and less risk than the efficient frontier implies you should be cautious… and consider calling the SEC.
On a personal note, Harry was an inspiration. I admired his devotion to learning and lifelong intellectual curiosity. He was thrilled to talk about using Monte Carlo simulation to optimize a fantasy baseball team when I was a teenager. In my 20s we sat side by side sharing programming tricks for algorithms in Matlab. Later he shared with me his own views on optimizing life—don’t waste time, have intellectually stimulating friends, an optimal spouse and a focus on happiness.
Market Performance
The second quarter witnessed the market technically entering a bull market, with the S&P 500 rising more than 20% from its October low. During the quarter, MSCI ACWI IMI and S&P 500 index gained 5.9% and 8.7%, respectively. The rally was largely driven by a handful of US large-cap tech companies that have benefited from an artificial intelligence boom. Notably, large-cap growth stocks delivered a year-to-date return of around 30%, effectively offsetting all the losses incurred in 2022. Value stocks, on the other hand, were only up less than 5% this year.
Unlike equities, bonds experienced a flat or negative quarter following a robust recovery earlier in the year. Market expectations shifted from anticipating rate cuts by year-end to pricing in two more hikes later in the year on the back of economic resilience and a strong labor market. This led to an overall upward shift in the Treasury yield curve, with the 2-year Treasury experiencing the largest increase of 80 basis points, reaching 4.87%. The US Agg bonds lost 0.94% and Long Treasury bonds fell 2.3% during the quarter.
International markets are also in a bull market, albeit with a different feel. Whereas the US market was fueled by the meteoric rise of a specific handful of companies, international markets rose more broadly. They posted a modest gain of 2.6% amidst Eurozone's recessionary data and the European Central Bank's eighth consecutive interest rate hike in June to combat sticky inflation. Asia-Pacific equities returned 2.9%, largely helped by Japanese shares, while Emerging Market equities, pulled back by China’s weaker-than-expected recovery, were up 2%.
Strategy Performance
All New Frontier’s ETF portfolios delivered positive returns in Q2, with aggressive risk profiles taking the lead.
For Global Core and Tax-Sensitive portfolios, the positive performance was largely driven by the equity exposure, with large-cap growth stocks being, by far, the best-performing assets in the second quarter. Bond returns were mixed, with long-duration Treasury bonds experiencing the greatest decline, while Treasury floating rate bonds delivered the strongest performance. High-yield bonds and Emerging Market bonds contributed significantly to the portfolio's performance. In terms of alternatives, Gold and REITs were among the main detractors this quarter.
New Frontier's Multi-Asset Income portfolios performed positively, despite the challenge of both rising interest rates and dividend-focused equities lagging the broad equity markets and turning negative. The portfolios benefited from diversified exposure to a broad range of high-dividend funds across various markets. Among the top performers were Emerging Market high-dividend fund and the market-cap weighted high-dividend fund. Notably, convertible bonds, which had been recently included to improve diversification through exposure to growth stocks, were the largest contributors to performance.
A note on indices and benchmark relative returns
Benchmarks are useful for measuring the performance of active managers with a mandate to “beat” an index. However, they make little sense for an investor looking to meet their financial goals. Due to the fact that it is not optimal, Markowitz was not a fan of the market portfolio. His 2005 paper proved the market portfolio can’t be on the efficient frontier because, as the average of everyone’s portfolio, it can’t be the best portfolio for anyone.
Every New Frontier portfolio is optimized for an investment objective and not directly related to an index. Since the right portfolio will invest in different assets than the benchmark, it will have a different return from the benchmark by design. Therefore, the portfolios are not expected to closely match the return of a standard benchmark.
Model Reallocation
There were no model rebalances this quarter. All non-tax sensitive models were updated to include the recent market conditions, in particular the sharply negative yield curve, and rebalanced late last quarter.
Refinements to the investment process include higher duration for mortgage-backed securities as decreased refinancing shifts their risk characteristics. Optimal allocations shifted to lower duration including a major allocation to ultra-low duration Treasury floating rate notes.
New Frontier uses the Michaud-Esch portfolio rebalance test to guide portfolio reallocation and rebalancing decisions. This framework allows us to simultaneously consider changes to the risk characteristics of portfolios from price movements, and changes to optimal portfolio exposures from new capital market expectations. The recently rebalanced ETF models remain statistically intact for their investment objectives.
Investment Themes
Artificial intelligence has been progressing for many years, but has recently broken through to investors’ imagination as a potentially enormous productivity enhancing technology. The early beneficiaries include the companies with direct interest in AI as well the chip makers, the equivalent of the shovel suppliers in the gold rush. However, novel developments rarely play out as expected. AI will ultimately impact the economy, boost productivity, and potentially create new beneficiaries, but there are many possible ways it could play out and it’s unlikely to be how anyone is imagining it today. Other than AI, there was little net positive news, so some investors exuberance for AI may be offset or hidden by continued caution of other investors anticipating recession.
This has implications for equity returns. While it doesn’t seem likely that AI will turn out to be a flop, valuations cannot go up forever so stock prices are at risk of falling. Furthermore, if U.S. recession is no longer priced into the market, a downturn could be painful for U.S. equities. International markets, at seemingly perennially lower valuations, and more importantly, at different stages of the inflation cycle, offer some potential for return. So, while no market is insulated from the U.S. economy, diversification is generally a good idea.
The picture for fixed income is clearer. 2023 continues to be a far better environment for fixed income than 2022. Falling inflation and rising rates means that real return on fixed income continues to increase. Higher yield translates to lower interest rate sensitivity for all bonds as more of the return of the bond is paid sooner through coupons rather than final principal. More importantly, higher yield provides a cushion of return should rates rise and prices fall. As 10-year rates rose 31bp to 3.81% this quarter, aggregate bonds fell 0.94% while a comparable 31bp increase in 10-year rates to 2.70% this quarter last year corresponded to a 1.81% loss1. The highly inverted yield curve and lack of clear risk premium for duration has continued to favor our recent optimization toward Treasury Floating Rate Notes. Balancing risks and accepting higher return from the yield curve remains attractive.
The Economy
The economy has largely remained stubbornly resilient with strong labor markets and an increasingly optimistic stock market anticipating productivity enhancements from AI despite stubborn inflation and tightening credit from higher rates and another significant banking failure.
Though resilient, growth is low. Bank failures and tighter credit have contributed to signs of weakness in manufacturing and technology layoffs. A slowdown or light recession remains the most likely endpoint of the current trajectory. Earnings growth forecasts are low, and the Fed predicts GDP growth of only 1% for the next year.
The Fed
The Fed maintained its position that roughly two further rate increases are necessary to fight inflation. The Fed then expects to gradually begin reducing rates starting some time in 2024 and continuing beyond that. In a dramatic change, markets have largely conceded to the Fed and are no longer predicting rate cuts before the end of the year. The Fed and markets are now the closest aligned since before the rate hikes began.
The result is long and intermediate rates are nearly unchanged from the start of the year to the end of the quarter, while short rates are up roughly 100bp. In the chart below, the Fed “dot plot” (red dots, blue line representing the median dot) shows rates close to 5.5% at the end of 2023, roughly 4.5% at the end of 2024 and broadly dispersed around a median of 3.5% at the end of 2025. These are unusually close to the market’s implied future rates (green line).
The Fed controls the short-term risk-free rate, but markets determine longer rates. As always, market prices are a complex equilibrium from many investors. Market prices do not represent a belief in a single scenario, but rather an average of many expectations and preferences. For example, low yields in the future may be due to investors expecting to profit from those positions or others looking to hedge risks in the future.
FOMC Dot Plot and market expectation implied by Overnight Index Swaps (OIS)
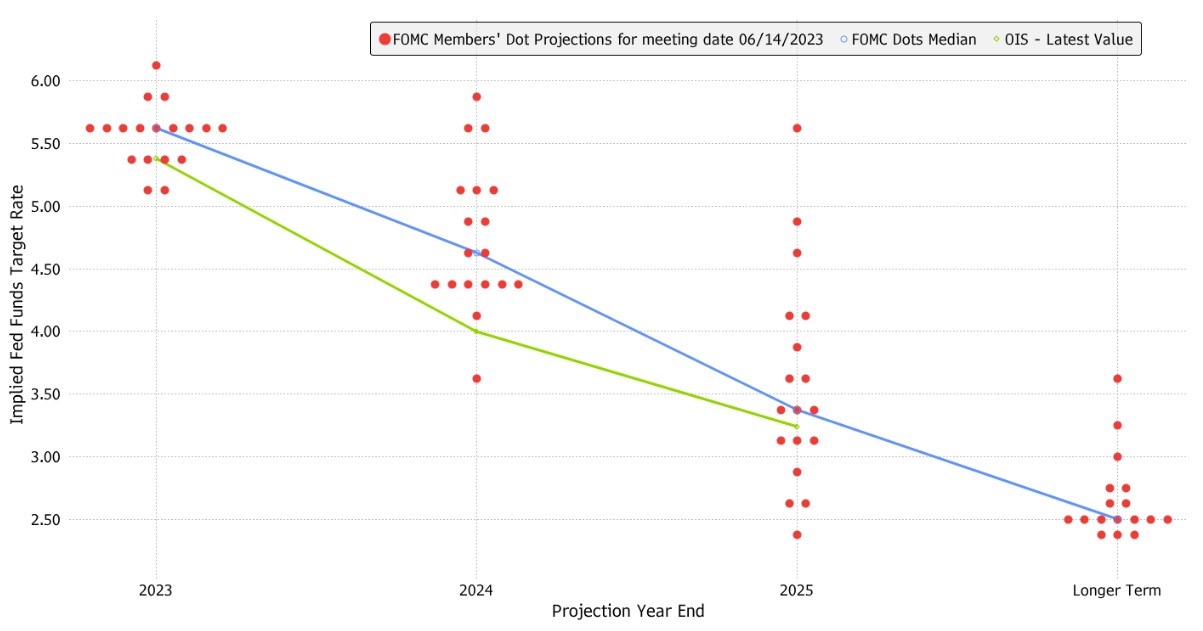
Source: Bloomberg as of 06/30/2023.
Other Themes
- China disappointed investors with sluggish growth despite its post-Covid reopening.
- The debt ceiling was raised with much unnecessary brinkmanship, but little impact other than concerns for next time.
- Active ETFs, while a relatively small part of the ETF market, have grown substantially as mutual fund conversions have continued to active management
- Bitcoin was given a boost to its legitimacy by Blackrock and others applying to issue spot (i.e. not futures-based) ETFs. This would eliminate a major hurdle for institutional investors to include Bitcoin in portfolios.
- ESG enthusiasm has waned with fund companies.
1Data sourced from AGG ETF and FRED data From 3/31/2023 to 6/30/2023. The best match from Q2 2022 was 4/1/2022 to 4/13/2022
DISCLOSURES: Past performance does not guarantee future results. As market conditions fluctuate, the investment return and principal value of any investment will change. Diversification may not protect against market risk. There are risks involved with investing, including possible loss of principal.